Monday, July 15, 2013

OBIEE 11.1.1.7 - Methods to browse data (scrolling or page controls)

Another new feature supported in OBIEE 11.1.1.7 is to keep the rows/columns headers visible.

Users have a choice to browse data by specifying the methods below

1) Fixed headers with scrolling content :( available for Table/Pivot views) - This option to use scrolling as the method to browse data
  • Keeps headers of rows and columns visible at all times
  • Includes horizontal and vertical scroll bars
2) Content paging - This option to use page controls as the method to browse data 

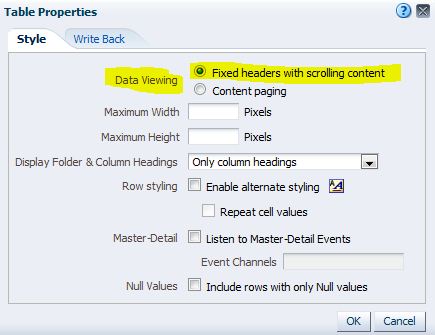
Table view properties - Fixed headers with scrolling

The report results (table view) with Fixed column header and a scroll bar.
Final Report  with Vertical Scrolling

Friday, July 12, 2013

OBIEE 11.1.1.7.0: Adding actions to reports from Totals, Sub-totals, and Grand Totals

New Feature: Ability to invoke an action from the column and (sub-totals, totals, Grand Totals) was added

Create a simple report (summary) on regional performance as below. To view the detail report from any row (sub-totals, totals and Grand Total), edit the column properties – select action links and check Enable on Totals. 

OBIEE 11.1.1.7 - column properties
 Sample reports (summary & detail)

Summary - action link on region totals
 
Detail report - for region Americas

OBIEE 11g: Display multiple reports using a variable prompt and conditional sections in a dashboard page.

Requirement is to switch between multiple reports in a dashboard page based on the prompt selected. Each report has different measures and display a report with all measures as default.To implement this scenario, followed the steps below.

1) Create a dashboard prompt
  • Select a variable prompt and set a presentation variable
  • Select choice list and add the custom values
  • For default selection, specify a value from the choice list
    Dashboard "variable" prompt
Prompt List

2) Create reports as per the requirements and also include the steps below
  • Add a dummy column and the custom formula to view the report as per selection (list) made in dashboard prompt. (the data type of my variable is Text.) 
  • Apply filter on the dummy column
  • For the default report with all measures, apply the column formula and filter as below
           CASE '@{sys_type}' WHEN 'All' THEN '1' ELSE '0' END 
           CASE '@{sys_type}' WHEN 'All' THEN '1' ELSE '0' END <> '0'
  • For "Gas" report, apply the column formula and filter as below
          CASE '@{sys_type}' WHEN 'Gas' THEN '1' ELSE '0' END 
          CASE '@{sys_type}' WHEN 'Gas' THEN '1' ELSE '0' END <> '0' 
  • For "Liquid" report, apply the column formula and filter as below
          CASE '@{sys_type}' WHEN 'Liquid' THEN '1' ELSE '0' END 
          CASE '@{sys_type}' WHEN 'Liquid' THEN '1' ELSE '0' END <> '0'
 
Column Formula

Column Filter

3) Add reports to the dashboard page and apply section condition for each report
  • Choose section properties, select condition
  • Create a condition based on Analysis, select the report and set “True if Row Count” to “is greater than” 0.
  • For the default report set condition as (ROWCOUNT('All') > 0)
  • For "Gas" report set condition as (ROWCOUNT('Gas') > 0)
  • For "Liquid" report set condition as (ROWCOUNT('Liqud') > 0)
Dashboard - Section Condition for report "All"

4) Save the dashboard and Click Run. The dashboard should display the default report only. From the drop-down list, users can view the selected report. 
Default report - All